Data Exchange
The Riverscapes Consortium organizes and serves data via the Data Exchange. The Data Exchange provides access to both the underlying data (packaged in riverscapes projects) as well as making these data explorable via an integrated explorer or interactive web maps. We only serve and host data packaged in fully Riverscapes-Compliant Riverscapes Projects.
Get Riverscapes Data Now
Discover and download data from the Riverscapes Data Exchange.
Goal
Make it easier to catalog, share, discover and retrieve the products of riverscapes analysis and modelling.
Advantages
The advantages of riverscapes projects being hosted in a data warehouse can include:
- Searchable and queryable catalog
- Custom web maps
- Custom field and desktop aApps
- Secure cloud hosting:
- Easy public sharing
- Full user access permission control
- Full integration with EC2 and Lambda for cloud-computing of Production-Grade riverscapes models.
- Creative Commons licensing of datasets
- Ability to mint DOIs to make datasets citable
- OGC API access to riverscapes projects and warehouse for programmers
- OGC Web Map Tile Services access to your datasets
- Searchable and discoverable in Riverscapes viewers GIS Toolbars
Overview
The playlist below contains videos the provide an overview of the Data Exchange and its functionality
The video below documented an earlier verion of the Data Exchange.
In this 8 minute video, we show off what these warehouses buy you in terms of housekeeping and reaching broader audiences.
Dataset Discrimination
We refer to ‘datasets’ as any input(s), output(s) or intermediate(s) used or produced by our various analyses, tools and workflows within the Riverscapes Consortium. Within the warehouse, we assign to each "dataset" node or instance within a Riverscapes Project we use a couple of concepts to differentiate and contextualize that data :
- Dataset Grade - Describes the rank of dataset curation using an adaptation of Bloom's Taxonomy of Educational Objectives
- Data Product Status Tags - Tracks overall status, degree of quality assurance and control, and data generation methods.
As scientists and analysts, we produce a plethora of datasets, some of which go no further than an exploratory analysis and some which are carefully documented, vetted, and validated before being made for external consumption. Not all datasets will proceed sequentially through all stages of dataset status below and some stages are reiterated (e.g. after expert calibration, an output may be requeued for QA/QC assurance. The idea behind dataset discrimination is to keep track of how far, and for what purpose a dataset was
In this 8 minute video, we lay out some concepts we're exploring with respect to dataset status:
Dataset Rank
Not all datasets are created equal, nor have all received the same amount of attention, curation, validating, curation and or story telling. Drawing from and adapting Bloom's Taxonomy of Educational Objectives, we define dataset grade in terms of a similar hierarchy of dataset curation (instead of skills and abilities) with six levels:
- Knowledge-Rank - A dataset representing raw data and observations.
- Comprehension-Rank - A dataset that is a derivative product from raw data or observation (e.g. a surface interpolated from raw sample points)
- Application-Rank - A dataset that represents the typical outputs generated in one realization from a tool or model.
- Analysis-Rank - A dataset that represents an an analysis, summary or interpretation from an application-rank dataset.
- Synthesis-Rank - A dataset that involves the pulling together of multiple analysis-rank datasets to describe a larger problem.
- Evaluation-Rank - A broader summary dataset that provides direct answers or insights into key scientific knowledge gaps or key management questions (e.g. what is published in a peer-reviewed paper as an "original contribution" or used as a basis for decision making)
In general, the higher tiered datasets represent what is filtered out through scientific inquiry from more basic and prolific datasets and observations into a higher form of knowledge. Higher-tiered datasets have more utility to managers to inform decision making, but scientists often at least want the transparency of knowing what datasets went into informing that synthesis or evaluation. Riverscapes Projects impose this transparency of what evidence every dataset originated from and allow iterative inquiry and exploration.
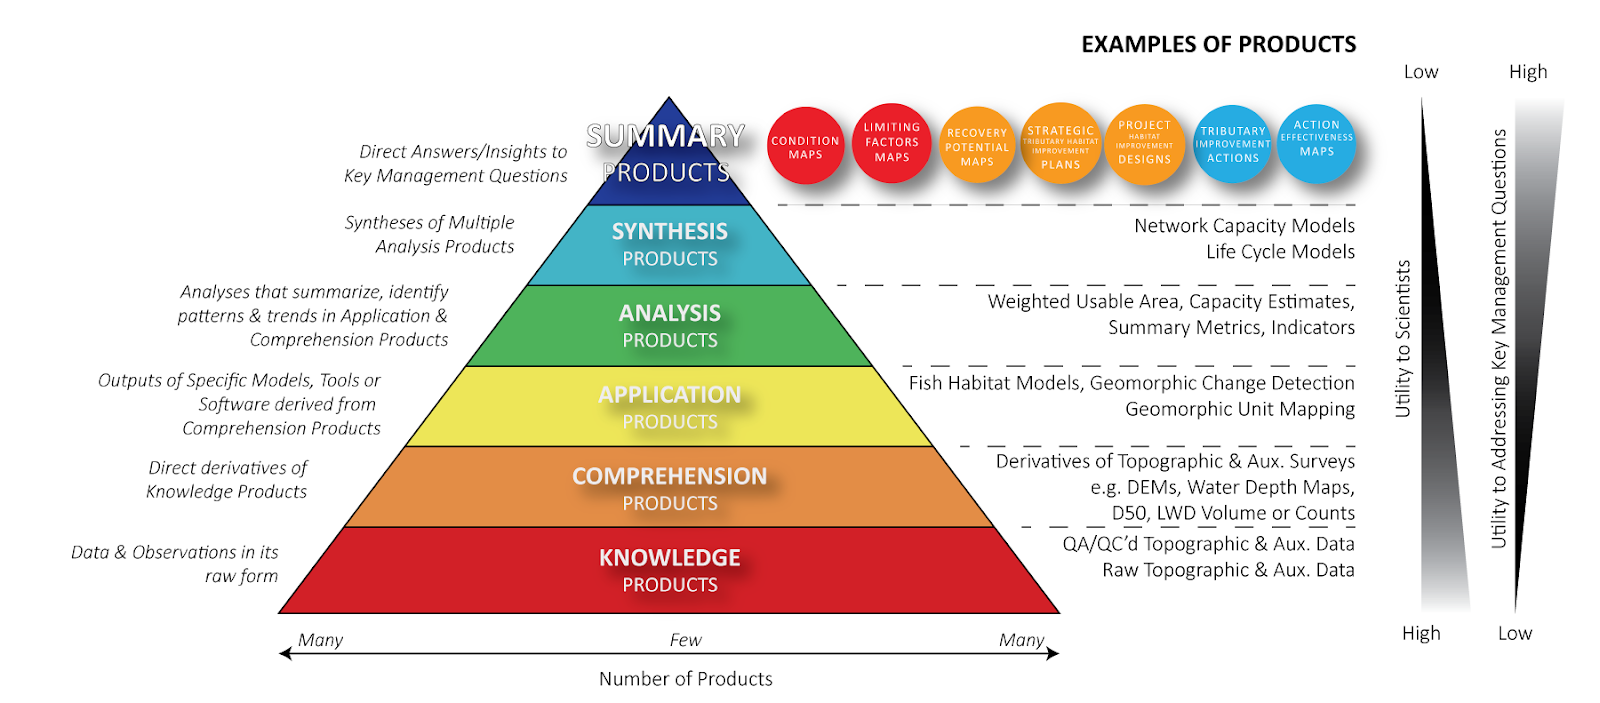
Idea from CHaMP
The idea to use Bloom's Taxonomy of Educational Objectives to communicate the rank or type of curation a dataset had received grew out of a need to communicate what utility the many different datasets we were producing in the CHaMP had. The figure below shows how we referred to datasets as "products" and uses specific examples of RC-tools and models to illustrate the ideas:
Dataset Status Tags
We use three optional status tags:
- Overall Status,
- QA/QC Review, and
- Data Generation
to track the development of a dataset. However, it is the Overall Status of a dataset that is most important for tracking its progression within a Riverscape Warehouse.
| Status Tags | Overall Status | QA/QC Review | Data Generation |
|---|---|---|---|
| None | None | ||
| Exploratory | Automated Testing | End-User | |
| Provisional | Manual Testing | Manual | |
| Final | Expert Calibrated | Automated-Local | |
| Promoted | Validated | Automated-Cloud |
Overall Status
Where in the dataset life cycle the dataset exists. The four status choices represent a progression.
- Exploratory - Preliminary datasets produced by an analyst to explore how well a particular analysis works, or to what extent a dataset gives insights into specific questions (e.g., an individual model run used for a talk). This is as far as the vast majority of analyses get.
- Provisional - A dataset that has undergone some degree of automated or manual QA/QC testing.
- Final - A dataset that has been validated and is trusted for inclusion in the riverscape warehouse. Upon elevation to a finalized status a dataset is available for use by team members and authorized partners. At this point the dataset has a DOI assigned so a static version is available for later reference.
- Promoted - A dataset promoted from a finalized riverscape warehouse output to ready for external consumption. The degree of documentation and vetting is generally higher than finalized outputs. Examples may include any datasets used in the preparation of a basin or restoration plan or peer-reviewed paper.
QA/QC Review
The degree of quality assurance and quality control checks that a dataset has been subjected to. The choices are not a progression per se, and a dataset may undergo just one or all four of these states.
- Automated Testing - All tool-generated outputs undergo some degree of quality assurance and quality control checking to flag outliers and mistakes. When a dataset has received QA/QC evaluation in an automated, centralized, production mode (e.g., GCD results checked for outliers) it is automatically queued for manual editing, checking and fixing.
- Manual Testing - A manual, expert evaluation of a dataset and its reporting.
- Expert Calibrated - An optional step of modifying model outputs by model iteration or analysis to produce new output based on expert modification of inputs and/or parameters to more realistic values.
- Validated- A dataset can be considered validated after it has undergone some form of testing and the relative quality of that dataset has been assessed and reported. If the inputs and/or parameters have been calibrated or modified with expert insights and the dataset generation has been iterative, the reporting includes how dataset quality has changed with that calibration process.
Data Generation
How the data datasets were generated
- Automated Local- Generated via batch processing using local network models.
- Automated Cloud - Generated via cloud processing using Cybercastor
- Manual - Generated via local tools on an individual basis.